NATURAL VARIABILITY RECONSTRUCTION
1925 – 1945 it is a bit of a mess, I suspect due to strongest geomagnetic jerk in the recorded data peaking in 1925
Geomagnetic jerks http://www.geomag.bgs.ac.uk/images/image018.jpg
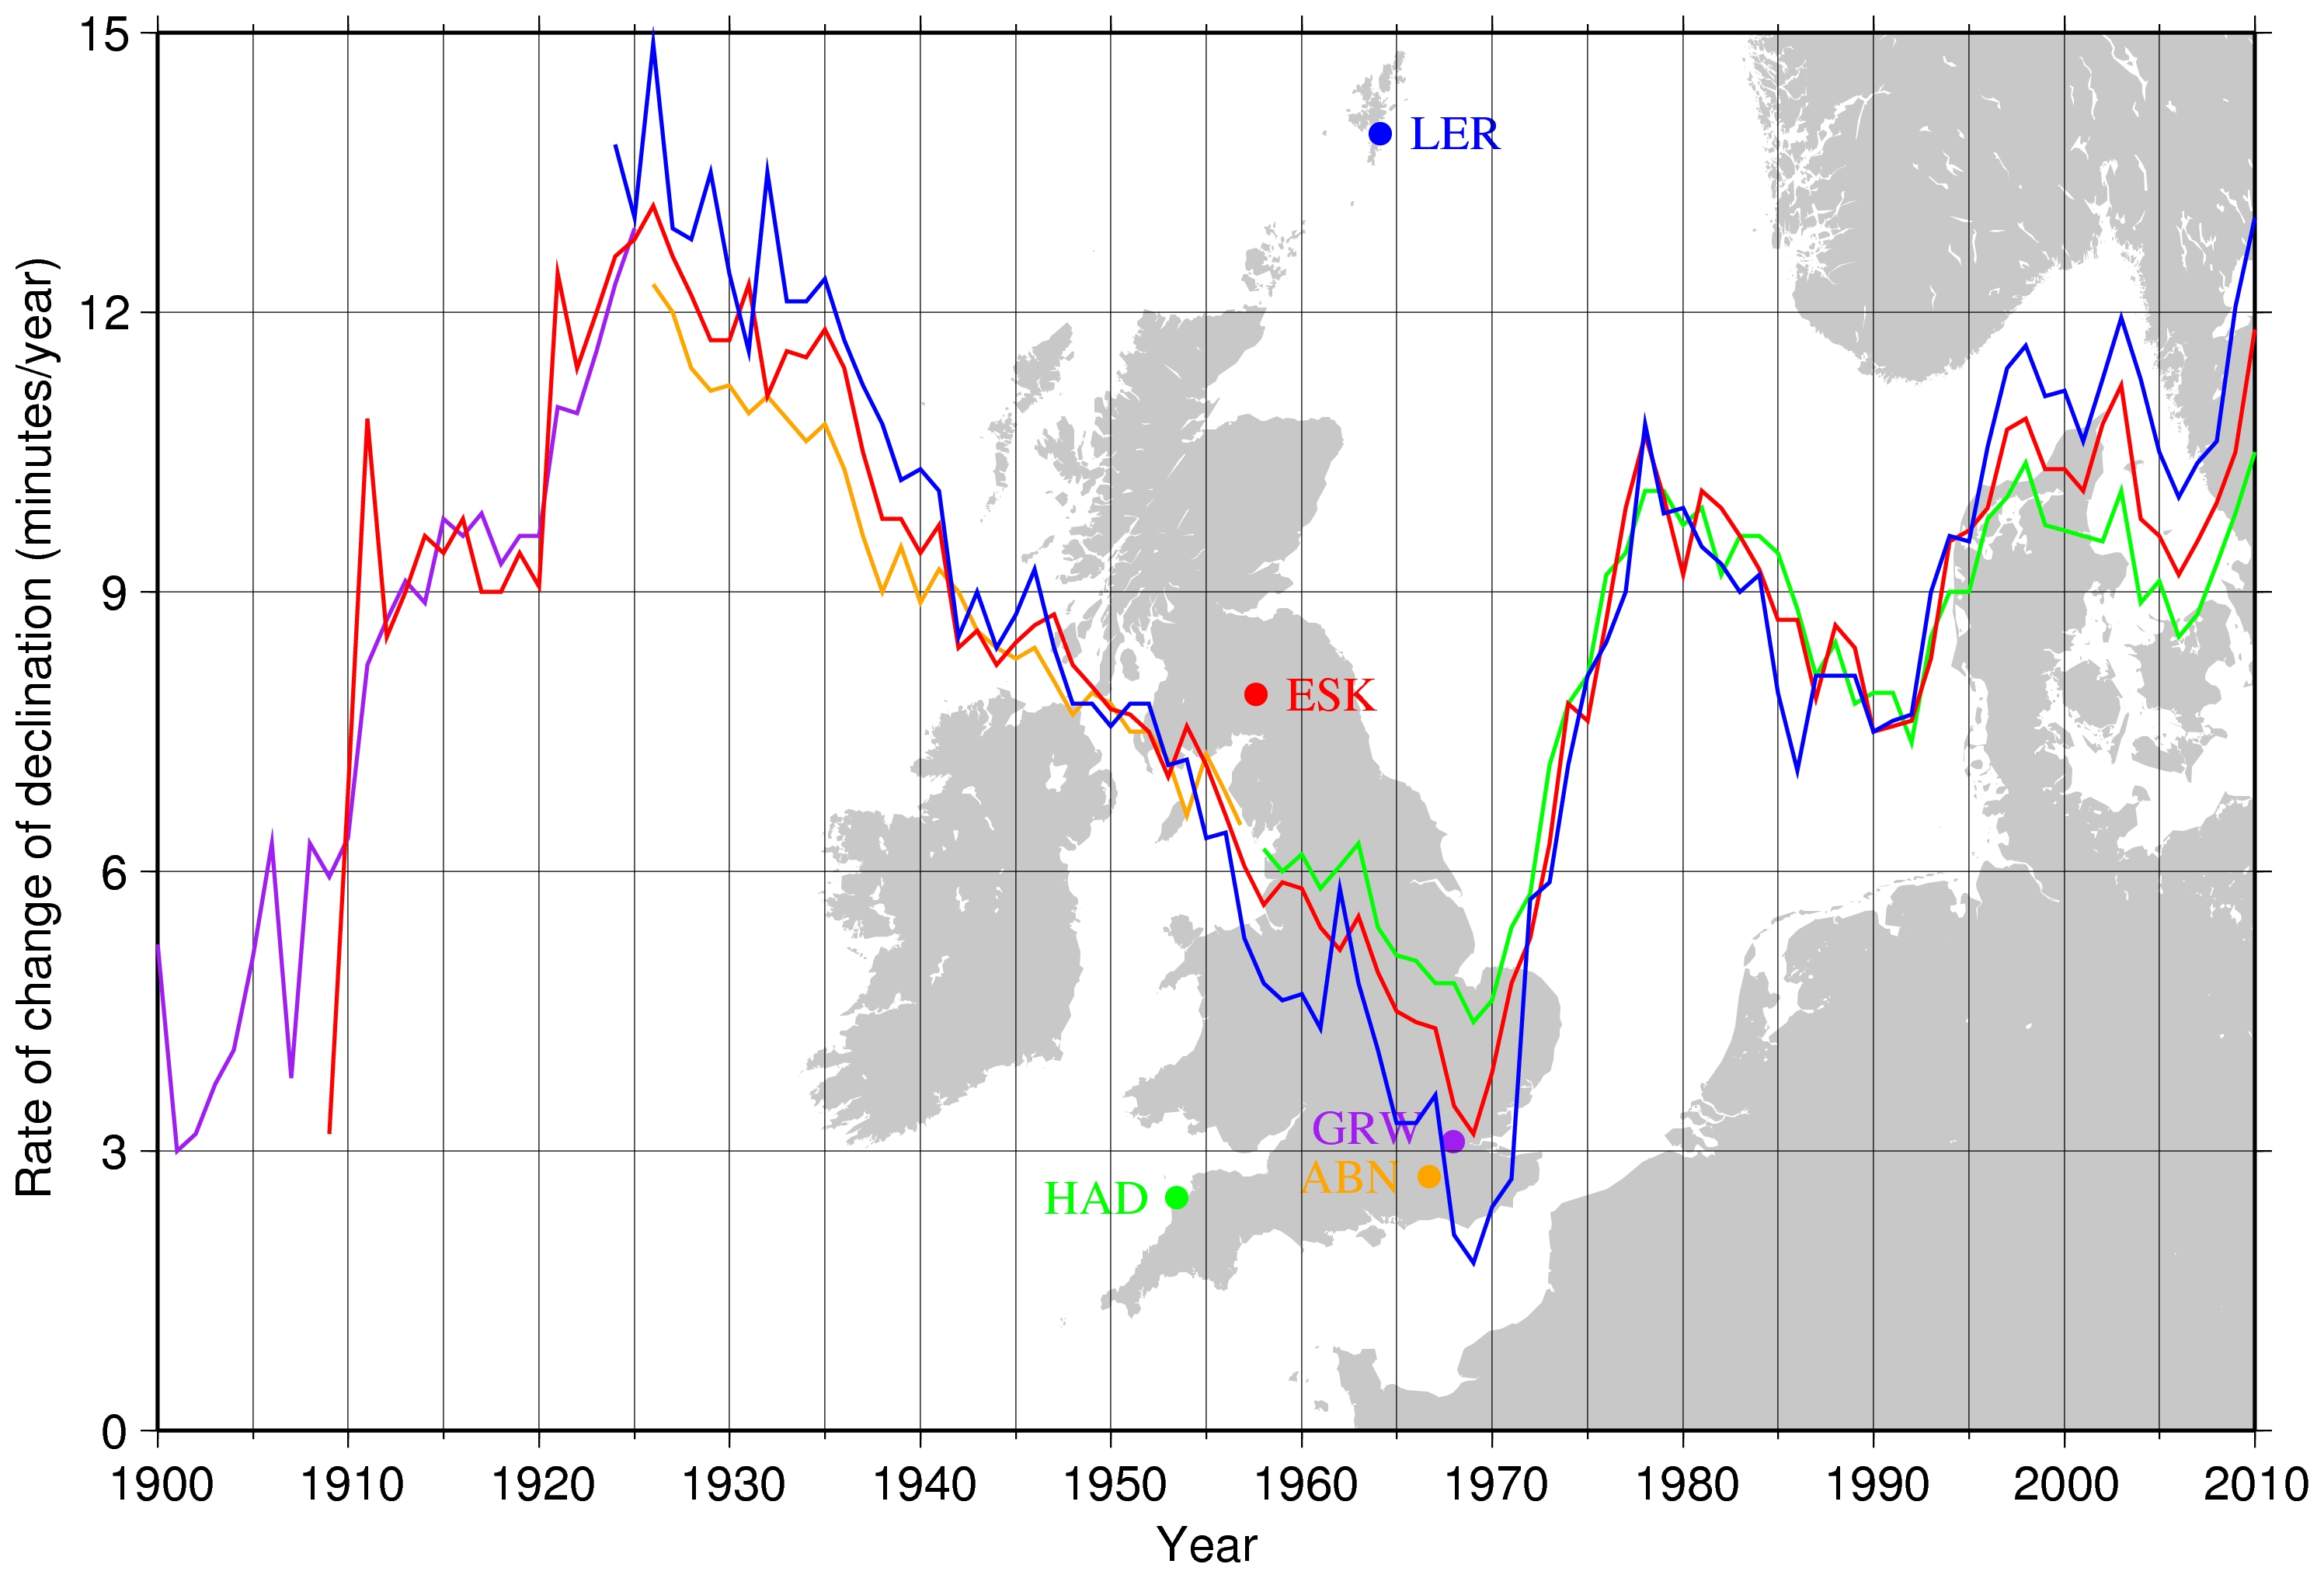
The rate of change of declination at Lerwick , Eskdalemuir and Greenwich -Abinger -Hartland observatory series in the UK is shown in
Figure 7. It can be seen from this plot that there have been a number of changes in the general trend of secular variation in the past, in
particular at about year 1925, 1969, 1978 and 1992. These sudden changes are known as jerks or impulses and, at the present time,
are not well understood and are not predictable. Some researchers have found evidence for a correlation with length-of-day changes .
http://www.geomag.bgs.ac.uk/education/earthmag.html
Data: Temperature : NASA-GISS 1880-2011 de-trended anomaly 3 year ma
Reconstructed and instrumental Ap-Index : 1844-2011 refer to Dr. L Svalgard, Stanford.edu
More charts can be found here: Graphs and Formulae