SUNSPOT CYCLE ANOMALY
Spectrum analysis shows strong 52 and 105 year peaks
 Graphic representation of the anomaly:
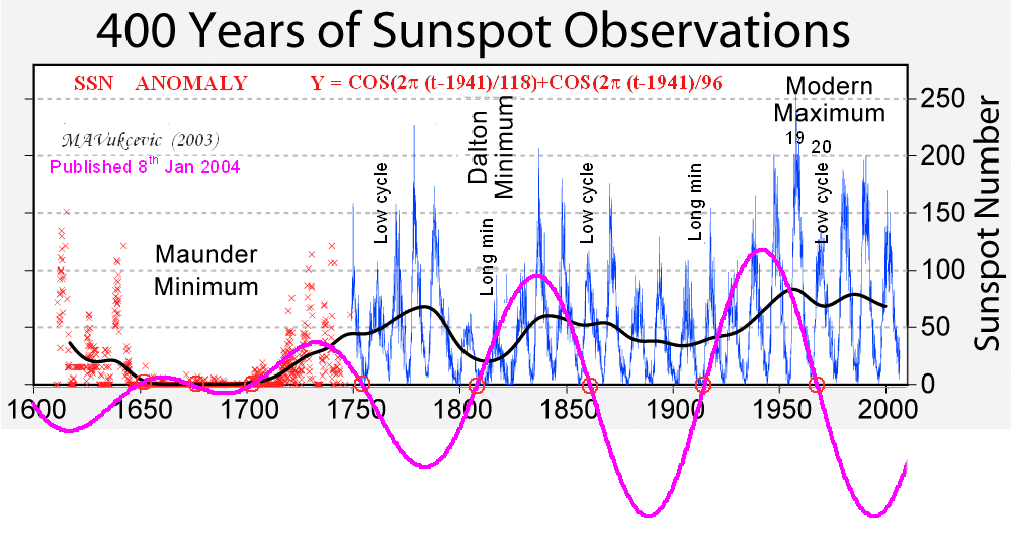 The graph depicts anomalies (with fundamental half-period of 52.5 years) within solar periodic activity with an immediately
recognisable minimum between 1650-1700, coinciding with the Maunder Minimum.
The graph depicts anomalies (with fundamental half-period of 52.5 years) within solar periodic activity with an immediately
recognisable minimum between 1650-1700, coinciding with the Maunder Minimum.
Further relevant dates are at or near the equation's zero value:
1809 - Dalton minimum;
1913 - another minimum but not so pronounced;
1860 and 1969 are the years of two cycles with suppressed amplitudes, 30% - 50% lower
than in the neighbouring peaks
The anomaly was first described here:Resonance
Possible consequences of the anomaly are also evident in:


More charts can be found here:
Graphs and Formulae
© m.a. vukcevic